It takes time to master the syntax and we suggest that readers should try to download and test the R software in their machine if they had not done so.
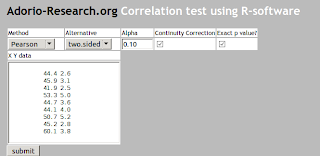
In this post, we shall describe our online solver for testing correlation between two variables X and Y.
The solver is mainly a web interface to the cor.test function available in R. This function has the following spec for input arguments:
cor.test(x, y,
alternative = c("two.sided", "less", "greater"),
method = c("pearson", "kendall", "spearman"),
exact = NULL, conf.level = 0.95, continuity = FALSE, ...)
Here is how our solver for correlation test looks like at the moment.
When the user clicks on the submit button, the solver will call the R software, grabs its output, and print the results:
0001 > x <- c(44.4,45.9,41.9,53.3,44.7,44.1,50.7,45.2,60.1)

0002 > y <- c(2.6,3.1,2.5,5.0,3.6,4.0,5.2,2.8,3.8)

0003 >

0004 > cor.test(x,y, alternative="two.sided", method="pearson",conf.level=0.9,exact=TRUE, continuity=TRUE)

0005

0006 Pearson's product-moment correlation

0007

0008 data:  x and y

0009 t = 1.8411, df = 7, p-value = 0.1082

0010 alternative hypothesis: true correlation is not equal to 0

0011 90 percent confidence interval:

0012 -0.02223023  0.86697863

0013 sample estimates:

0014 cor

0015 0.5711816

0016

0017 >
The printed p-value .1082 tells us not to reject the Null hypothesis that the correlation between
x and y is zero.
We will a scattergraph to the solver in the future.
Here is our interface code for the correlation test.
__version__ = "0.0.2"
__catalog__ = "TEST-STAT-0036"
__date__    = "2011.02.14"
__author__  = "E.P. Adorio"


from   qp.fill.form     import Form, SingleSelectWidget, RadiobuttonsWidget, TextWidget, StringWidget, CheckboxWidget
from   qp.sites.extreme.lib.uicommon  import renderheader, renderfooter, processheader, processfooter
from   math             import sqrt
from   qp.sites.extreme.lib.webutils import vecRead
from   qp.sites.extreme.lib   import webutils
from   qp.fill.directory import Directory
from   qp.pub.common     import header, footer, page, redirect
from   qp.fill.css  import BASIC_FORM_CSS
from   qp.sites.extreme.lib.webutils import vecRead, matRead, matReadByColumn, runRcode
from   qp.sites.extreme.lib.qpyutils        import printRlines, showLogo


from   scipy          import stats

import time
from   scipy          import stats

import copy
import math


def getGrFile(grType):
    grfile   = GraphicsFile("%s" % grType)
    barefile = grfile.split(str("/"))[-1]
    return grfile, barefile

def getformDict(form):
    D={}
    for field in form.get_all_widgets():
        D[field.name] = form.get(field.name)
    return D

def asColumns(S, ncolumns):
    """
    Args:
      ncolumns is number of columns.
      S is a string containing a space delimited columns of values.
    Return value
      a list consisting of the columns of S.
    """
    columns = [[] for i in range(ncolumns)]
    for i, v in enumerate(S.split()):
        columns[i % ncolumns].append( v)
    return columns

def asRvector(x):
    """
    Arg
      x - Python string array.
    Return value
      an R vector as a string c(v1,....vn)
    """
    S = "c("
    for v in x:
        S += str(v) + ","
    S += ")"
    return S.replace(",)", ")")


def SolveProblem(form):
    D    = getformDict(form)
    x, y = asColumns(D["pairedSample"], 2)
    alpha       = float(D["alpha"])
    method      = D["method"]
    alternative = D["alternative"]
    cont        = D["continuity_correction"]
    exact       = D["exact"]

    exact = "TRUE" if exact else "FALSE"
    cont  = "TRUE" if cont else  "FALSE"

    xstr = "x <- " + asRvector(x)+"\n"
    ystr = "y <- " + asRvector(y)+"\n"
    Rcode =xstr + ystr

    conflevel = 1-alpha

    Rcode += """
cor.test(x,y, alternative="%s", method="%s",conf.level=%s,exact=%s, continuity=%s)
""" %(alternative, method,conflevel, exact, cont)

    # create the R command.
    Rcode = Rcode.replace(",)", ")")
    return runRcode(Rcode)


class CorrTestPage(Directory):
    def get_exports(self):
        yield ('',       'index',   'Correlation test for Paired Data', "R stat software corr.test for Correlation")

    def index[html](self):
        form = Form(enctype = "multipart/form-data")

        form.add(CheckboxWidget, name = "continuity_correction", \
                 value = True,
                )
        form.add(CheckboxWidget, name = "exact", \
                 value = True,
                )

        form.add(TextWidget,  name = "pairedSample",  \
                 rows = "10", cols = "30", value="""
          44.4 2.6
          45.9 3.1
          41.9 2.5
          53.3 5.0
          44.7 3.6
          44.1 4.0
          50.7 5.2
          45.2 2.8
          60.1 3.8
                """
                )

        form.add(StringWidget, name = "alpha", size = 5, value = "0.10")
        form.add(SingleSelectWidget, name="alternative", options=[
                 ("two.sided", "two.sided"),
                 ("less", "less"),
                 ("greater", "greater")])

        form.add(SingleSelectWidget, name="method", options=[
                 ("pearson", "Pearson"),
                 ("kendall", "Kendall"),
                 ("spearman", "Spearman")])


        form.add_hidden("time",   value = time.time())
        form.add_submit("submit", "submit")


        def render [html] ():
            renderheader("Correlation test using R-software")

            pairedSample = form.get_widget("pairedSample")
            alpha = form.get_widget("alpha")
            exact = form.get_widget("exact")
            method   = form.get_widget("method")
            alternative = form.get_widget("alternative")
            cont = form.get_widget("continuity_correction")
            """
| Method | Alternative | Alpha | Continuity Correction | Exact p value? |
| %s | %s | %s | %s | %s |
| X Y data | ||||
| %s | ||||
renderfooter(form, __version__, __catalog__, __author__)
if not form.is_submitted():
return page('CorrTestPage', render(), style= BASIC_FORM_CSS)
def process [html] ():
processheader("Correlation test using R software corr.test() function")
calctime_start = time.time()
if True:
flag, output = SolveProblem(form)
printRlines(output)
if 0:
for widget in form.get_all_widgets():
"
" % (widget.name, widget.value)
processfooter(form, calctime_start, "./", "./stest_t1samp")
process()

Is there a Rubiks Cube online solver?
ReplyDeleteI just got a new Rubix cube and I scrambled it up. Now I can't figure out how to solve it, the videos and everything are useless to me because I can't understand algorithms that well... But is there like a robot that can help you solve the rubix cube? Like you could set what colors are in what position, etc. I really wanna solve my Rubik's Cube
This comment has been removed by a blog administrator.
ReplyDeletewhat editor are you using? nice theme
ReplyDeleteLegal Software Singapore